Using FusionCharts with ASP > Client Side Dynamic Charts
In our previous example, we have created drill-down chart which can show more information. Here, we'll quickly run through a sample to see how we can put dynamic data from database, in conjunction with JavaScript, to create dynamic client side charts. Note that all XML data for the pie chart will be fully created in ASP at run-time.
Before you go further with this page, we recommend you to please see the previous sections like "Basic Examples", "Plotting From Database" and "Creating Drill-Down Charts" as we start off from concepts explained in these pages.
The code examples contained in this page are contained in Download Package > Code > ASP > DB_JS folder.
<%@ Language=VBScript %>
<HTML>
<HEAD>
<TITLE>FusionCharts Free - Client Side Dynamic Chart ( using Database) Example</TITLE>
<SCRIPT LANGUAGE="Javascript" SRC="../../FusionCharts/FusionCharts.js"></SCRIPT>
<!-- #INCLUDE FILE="../Includes/FusionCharts.asp" -->
<!-- #INCLUDE FILE="../Includes/DBConn.asp" -->
<%
'In this example, we show a combination of database & JavaScript rendering using FusionCharts.
'The entire app (page) can be summarized as under. This app shows the break-down
'of factory wise output generated. In a pie chart, we first show the sum of quantity
'generated by each factory. These pie slices, when clicked would show detailed date-wise
'output of that factory.
'
'The XML data for the pie chart is fully created in ASP at run-time. ASP interacts
'with the database and creates the XML for this.
'Now, for the column chart (date-wise output report), we do not submit request to the server.
'Instead we store the data for the factories in JavaScript arrays. These JavaScript
'arrays are rendered by our ASP Code (at run-time). We also have a few defined JavaScript
'functions which react to the click event of pie slice.
'
'We've used an Access database which is present in ../DB/FactoryDB.mdb.
'It just contains two tables, which are linked to each other.
'
'Before the page is rendered, we need to connect to the database and get the
'Data, as we'll need to convert this data into JavaScript variables.
'The following string will contain the JS Data and variables.
'This string will be built in ASP and rendered at run-time as JavaScript.
'
Dim jsVarString
jsVarString = ""
'Database Objects - Initialization
Dim oRs, oRs2, strQuery,indexCount
indexCount = 0
'Create the recordset to retrieve data
Set oRs = Server.CreateObject("ADODB.Recordset")
'Iterate through each factory
strQuery = "select * from Factory_Master"
Set oRs = oConn.Execute(strQuery)
While not oRs.EOF
indexCount = indexCount + 1
'Create JavaScript code to add sub-array to data array
'data is an array defined in JavaScript (see below)
'We've added vbTab & vbCRLF to data so that if you View Source of the
'output HTML, it will appear properly. It helps during debugging
jsVarString = jsVarString & vbTab & vbTab & "data[" & indexCount & "] = new Array();" & vbCRLF
'Now create second recordset to get date-wise details for this factory
Set oRs2 = Server.CreateObject("ADODB.Recordset")
strQuery = "select * from Factory_Output where FactoryId=" & ors("FactoryId") & " order by DatePro Asc" & vbCRLF
Set oRs2 = oConn.Execute(strQuery)
While not oRs2.EOF
'Put this data into JavaScript as another nested array.
'Finally the array would look like data[factoryIndex][i][dataLabel,dataValue]
jsVarString = jsVarString & vbTab & vbTab & "data[" & indexCount & "].push(new Array('" & datePart("d",ors2("DatePro")) & "/" & datePart("m",ors2("DatePro")) & "'," & ors2("Quantity") & "));" & vbCRLF
oRs2.MoveNext()
Wend
'Close recordset
Set oRs2 = Nothing
oRs.MoveNext()
Wend
%>
<SCRIPT LANGUAGE="JavaScript" >
//Here, we use a mix of server side script (ASP) and JavaScript to
//render our data for factory chart in JavaScript variables. We'll later
//utilize this data to dynamically plot charts.
//All our data is stored in the data array. From ASP, we iterate through
//each recordset of data and then store it as nested arrays in this data array.
var data = new Array();
<%
'Write the data as JavaScript variables here
Response.Write(jsVarString)
'The data is now present as arrays in JavaScript. Local JavaScript functions
'can access it and make use of it. We'll see how to make use of it.
%>
/**
* updateChart method is invoked when the user clicks on a pie slice.
* In this method, we get the index of the factory, build the XML data
* for that that factory, using data stored in data array, and finally
* update the Column Chart.
* @param factoryIndex Sequential Index of the factory.
*/
function updateChart(factoryIndex){
//defining array of colors
//We also initiate a counter variable to help us cyclically rotate through
//the array of colors.
var FC_ColorCounter=0;
//var arr_FCColors= new Array(20);
var arr_FCColors= new Array("1941A5" , "AFD8F8", "F6BD0F", "8BBA00", "A66EDD", "F984A1", "CCCC00", "999999", "0099CC", "FF0000", "006F00", "0099FF", "FF66CC", "669966", "7C7CB4", "FF9933", "9900FF", "99FFCC", "CCCCFF", "669900");
//Storage for XML data document
var strXML = "<graph caption='Factory " + factoryIndex + " Output ' subcaption='(In Units)' xAxisName='Date' decimalPrecision='0'>";
//Add <set> elements
var i=0;
for (i=0; i<data[factoryIndex].length; i++){
strXML = strXML + "<set name='" + data[factoryIndex][i][0] + "' value='" + data[factoryIndex][i][1] + "' color='"+ arr_FCColors[++FC_ColorCounter % arr_FCColors.length] +"' />";
}
//Closing graph Element
strXML = strXML + "</graph>";
//Update it's XML
updateChartXML("FactoryDetailed",strXML);
}
</SCRIPT>
</HEAD>
<BODY>
<%
Initialize the Pie chart with sum of production for each of the factories
'strXML will be used to store the entire XML document generated
Dim strXML
'Re-initialize Index
indexCount=0
'Generate the graph element
strXML = "<graph caption='Factory Output report' subCaption='By Quantity' decimalPrecision='0' showNames='1' numberSuffix=' Units' pieSliceDepth='20' formatNumberScale='0' >"
'Move back to first index of the factory master recordset
oRs.MoveFirst()
While Not oRs.Eof
'Update index count - sequential
indexCount = indexCount + 1
'Now create second recordset to get details for this factory
Set oRs2 = Server.CreateObject("ADODB.Recordset")
strQuery = "select sum(Quantity) as TotOutput from Factory_Output where FactoryId=" & ors("FactoryId")
Set oRs2 = oConn.Execute(strQuery)
'Generate <set name='..' value='..' link='..' />
'Note that we're setting link as updateChart(factoryIndex) - JS Function
strXML = strXML & "<set name='" & ors("FactoryName") & "' value='" & ors2("TotOutput") & "' link='javascript:updateChart(" & indexCount & ")'/>"
'Close recordset
Set oRs2 = Nothing
oRs.MoveNext
Wend
'Finally, close <graph> element
strXML = strXML & "</graph>"
Set oRs = nothing
'Create the chart - Pie 3D Chart with data from strXML
Call renderChart("../../FusionCharts/FCF_Pie3D.swf", "", strXML, "FactorySum", 650, 300)
%>
<%
'Column 2D Chart with changed "No data to display" message
'We initialize the chart with <graph></graph>
Call renderChart("../../FusionCharts/FCF_Column2D.swf?ChartNoDataText=Please click on a pie slice above to view detailed data.", "", "<graph></graph>", "FactoryDetailed", 600, 300)
%>
</BODY>
</HTML>
As you can see in the code above, we're doing the following:
We include FusionCharts.js JavaScript class and FusionCharts.asp, to enable easy embedding of FusionCharts.
We then include DBConn.asp, which contains connection parameters to connect to Access database.
We use ASP to connect to Factory_Output table, retrieve daily production details of each factory and store the entire data in a JavaScript array - data. This array is populated by ASP script.
Again, we use ASP to connect to Factory_Master table to retrieve the sum of production for each of the factories. Using this data we generate the XML data document and store the XML data in strXML variable. To each <set> element, we add the link attribute, which points to JavaScript updateChart()method.
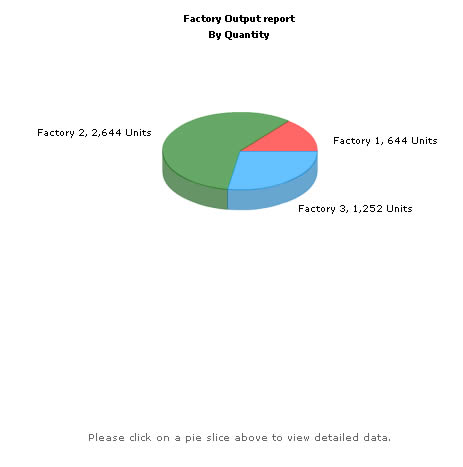
Thereafter, we render the Pie chart using the generated XML data.
Below it a Column2D chart is also initialized with no chart data. We also change the default chart message -'No data to display' to
'Please click on a pie slice above to view detailed data.'.
We do this by passing a query parameter - ChartNoDataText to the chart while calling the
renderChart() method:
Call renderChart("../../FusionCharts/FCF_Column2D.swf?ChartNoDataText=Please click on a pie slice above to view detailed data.", "", ...)
Note that using this method you can always change various chart messages to make the charts more interactive and intuitive. You can use PBarLoadingText (displayed while the chart swf is loaded from server),
XMLLoadingText (displayed while XML data is retrived),
ParsingDataText (displayed while XML data is parsed),
ChartNoDataText (displayed when chart has no data to display),
RenderingChartText ( displayed when chart is rendered),
LoadDataErrorText (displayed when error occurs in loading data),
InvalidXMLText (displayed when XML data is invalid).
For more on this please see Advanced Charting > Changing Chart Messages section.
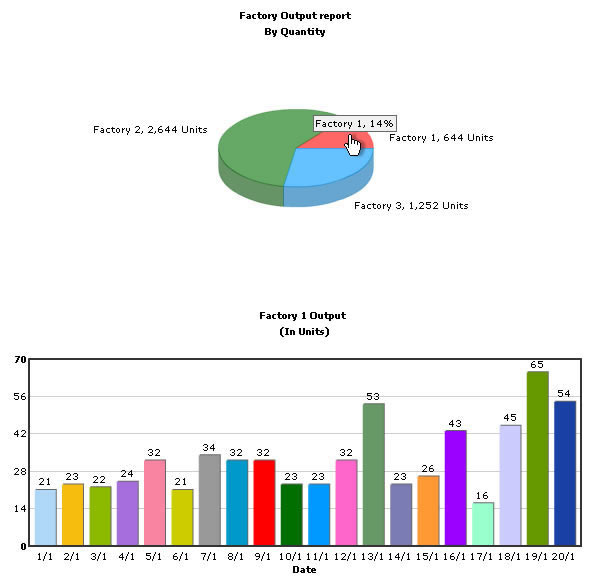
When you now run the app you'll see the page as under:
When a Pie slice is clicked, the factory id of the respective factory is passed as parameter to updateChart() method. updateChart() method generates XML data from data array using the specified factory id. Then it calls the updateChartXML() method defined in FusionCharts JavaScript class.
updateChartXML() method uses dataXML method to dynamically update charts. It updates the Column2D chart with the newly generated XML data to show detailed daily production of the respective factory.
When you click on a pie slice, say Factory 1 ( Red slice), you'll see the detailed page as under: